You know the drill. It’s crunch time, leadership wants “the numbers,” and you’re staring at a spreadsheet export with 4,000 rows, twelve columns, and a tab named Sheet3 (final) (USE THIS ONE). Somewhere in that mess is a story — but pulling it out means hours of pivot tables, chart formatting, and writing a summary nobody will read past the first paragraph.
Here’s the shift that’s quietly changing back-office work: you can now hand that raw export to an AI, describe what your boss cares about, and get polished charts plus a written summary back in minutes. No formulas. No “how do I make this bar chart not ugly.” Just raw data in, decision-ready report out.
Let’s walk through what that actually looks like — and where it helps versus where you still need a human in the loop.
What a KPI dashboard really is:
A KPI dashboard is just the handful of numbers that tell you if things are going well, shown in a way you can read at a glance. KPI stands for “key performance indicator” — emphasis on key. The mistake most reports make is showing everything. A good dashboard shows the five or six things that actually drive a decision.
For a sales team that might be revenue, new customers, churn, and average deal size. For a support team: tickets opened, tickets closed, and average response time. The data already exists — it’s trapped in exports, CRMs, and spreadsheets. The job is turning it into something a busy executive can absorb in thirty seconds.
That “turning it into something readable” step is exactly what AI is now good at.
The workflow: three steps:
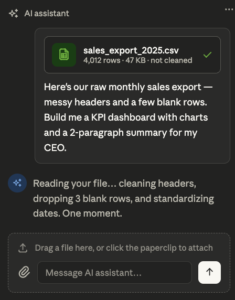
Step 1 — Drop in the raw data. Export whatever you have as a CSV or Excel file (every tool has an “Export” button) and upload it to an AI assistant. You don’t need to clean it first. Messy headers, blank rows, weird date formats — modern AI tools handle the cleanup that used to eat your afternoon.
Step 2 — Tell it who the report is for. This is the part people skip, and it’s the most important. The same data becomes a completely different report depending on the audience. Compare:
“Summarize this sales data.” → a generic wall of numbers.
“My CEO has five minutes and cares about whether we’ll hit our Q3 target and what’s putting it at risk. Pull the three most important trends, make a clean chart for each, and write a two-paragraph summary in plain English.” → an actual executive report.
You’re not writing code. You’re briefing an assistant the way you’d brief a sharp new analyst.
Step 3 — Review, refine, and ship. The AI hands back charts and a summary. You read it, push back where needed (“the revenue chart should be monthly, not weekly”; “soften the conclusion, we don’t want to alarm anyone”), and it revises on the spot. Two or three rounds and you have something polished.
A quick before-and-after
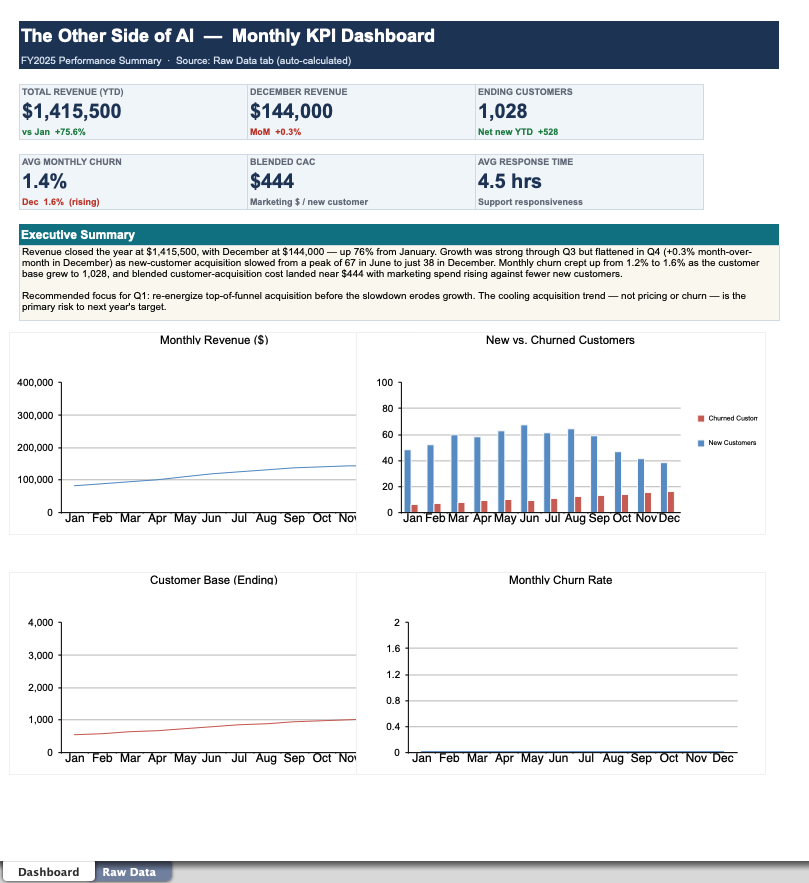
Say you upload a year of monthly sales numbers and ask for an executive summary. Instead of a raw table, you get back something like:
Revenue grew 18% year-over-year, but the last two months flattened. Q1 and Q2 were driven by enterprise deals, while the recent slowdown traces to a 30% drop in new mid-market customers. If the mid-market trend continues, we’ll finish the year roughly 6% under target. Recommended focus: the mid-market pipeline.
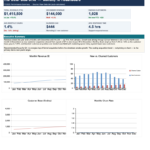
…paired with a clean line chart of monthly revenue and a bar chart comparing customer segments. That’s the difference between data and a report. The numbers were always there; the AI did the framing, the visuals, and the plain-English translation.
Where this genuinely saves you time
The formatting grind. Charts that look presentable without you fighting Excel’s defaults for an hour.
The “so what?” paragraph. Turning numbers into a narrative is the part most people dread, and it’s where AI shines.
Repeatability. Once you’ve nailed the prompt for your monthly report, you reuse it every month. Same brief, new data, done in minutes.
Tailoring to the room. One dataset, three versions — a detailed one for your team, a high-level one for the board, a one-liner for the group chat.
Where you still need to be the human
AI is a fast, tireless analyst — not an accountable one. Keep these guardrails:
Check the math on anything that matters. AI can misread a column or make a confident-sounding error. For numbers going to leadership or clients, verify the key figures against the source.
Mind the confidential data. Don’t upload sensitive customer, financial, or personal data into a tool that isn’t approved by your company. Know your organization’s policy first.
You own the conclusion. The AI can surface “mid-market is slipping,” but deciding what to do about it — and standing behind it in the meeting — is still your job. That’s the part that makes you valuable.
Getting started this week
Pick the report you dread most — the recurring one that eats half a day. Next time it’s due, export the raw data, write a clear brief describing your audience and what they care about, and let an AI take the first pass. Edit what it gives you instead of building from a blank page.
You’ll likely cut the time in half on the first try, and far more once you’ve tuned your prompt. That’s the whole promise of the other side of AI: not replacing your judgment, but clearing away the busywork so you can spend your time on the part that actually requires a human.